使えなくなってしまったPython + Basemapの代わり、とりわけ自由に使える白地図・ベースマップ、という点において、(GMTの他、)シェープファイル Shapefile .shpをGISソフトでいじるなど何か別の方法を探す必要が出てきた。
ただ、プロットしたり、線引きする程度の使い方ならば、Leafletで間に合いそう。
ちょっとした条件分岐もLeafletで間に合う。
下の図は、以前、Python + Basemapでプロットした地図と同じ。そのLeaflet版。
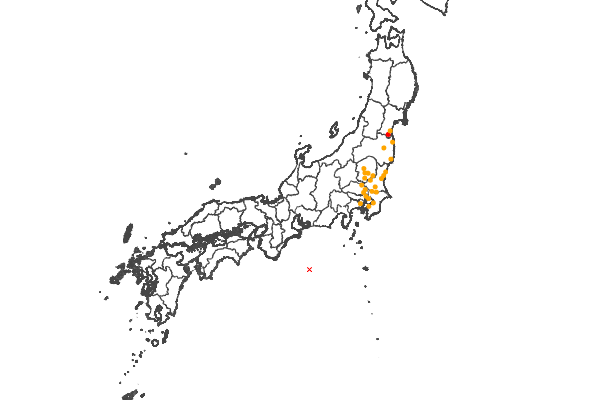
プロットいっぱい -地震- →
JQueryの$.getJSON(……
L.geoJson(……
でGeoJSONファイル(eq20190728.geojson)を読み込み。
基本的にはJavaScriptなので、if~else文で条件分岐。
feature.properties.○○○の○○○は、GeoJSONファイルの列名と対応。
$.getJSON("eq20190728.geojson", function(data) {
var point = L.geoJson(data, {
	pointToLayer: function (feature, latlng) {
	if (feature.properties.LEVEL == 3) {
	return L.circle(latlng,100, {color: 'orange'})
	}
	else{
	return L.circle(latlng,200, {color: 'red'})
	}
	},
	onEachFeature: function (feature, layer) {
	layer.bindPopup(feature.properties.MUNI);
	}
 });
 point.addTo(map)
 });
×などの文字列は、L.divIconとCSSで表示できる。L.iconと同じような使い方。
var divIcon2 = L.divIcon({
className:'divIcon2',
html:'×'
});
L.marker([33.16 , 137.40],
{icon:divIcon2})
.addTo(map)
.bindPopup("震源地")
CSS <style> </style>内に
.divIcon2{font-size:12px;color:red}ついでにもう1つ、8月14日、新潟県上越市高田で40.3℃を記録(今年最高)したので、日本全土の最高気温をプロットしてみた。
気象庁HP(www.jma.go.jp/) - 各種データ・資料 - 最新の気象データ - 今日の全国データ一覧表などからGeoJSONファイルを作成して、Leafletでプロット。
if~else文で条件分岐。凡例はないけど5℃おきに色分け。
高田紅一点。富士山は別世界。日光が涼しそう。
$.getJSON("kisyo_temp20190814.geojson", function(data) {
var point = L.geoJson(data, {
	pointToLayer: function (feature, latlng) {
	if (feature.properties.temp_max >= 40) {
	return L.circle(latlng,100, {color: 'red'})
	}
	if ((feature.properties.temp_max >= 35) & (feature.properties.temp_max < 40)) {
	return L.circle(latlng,100, {color: 'orange'})
	}
	if ((feature.properties.temp_max >= 30) & (feature.properties.temp_max < 35)) {
	return L.circle(latlng,100, {color: 'yellow'})
	}
	if ((feature.properties.temp_max >= 25) & (feature.properties.temp_max < 30)) {
	return L.circle(latlng,100, {color: 'skyblue'})
	}
	if ((feature.properties.temp_max >= 20) & (feature.properties.temp_max < 25)) {
	return L.circle(latlng,100, {color: 'blue'})
	}
	else{
	return L.circle(latlng,100, {color: 'purple'})
	}
	},
	onEachFeature: function (feature, layer) {
	layer.bindPopup(feature.properties.kansokujo + ":" + feature.properties.temp_max + "℃");
	}
});
point.addTo(map)
});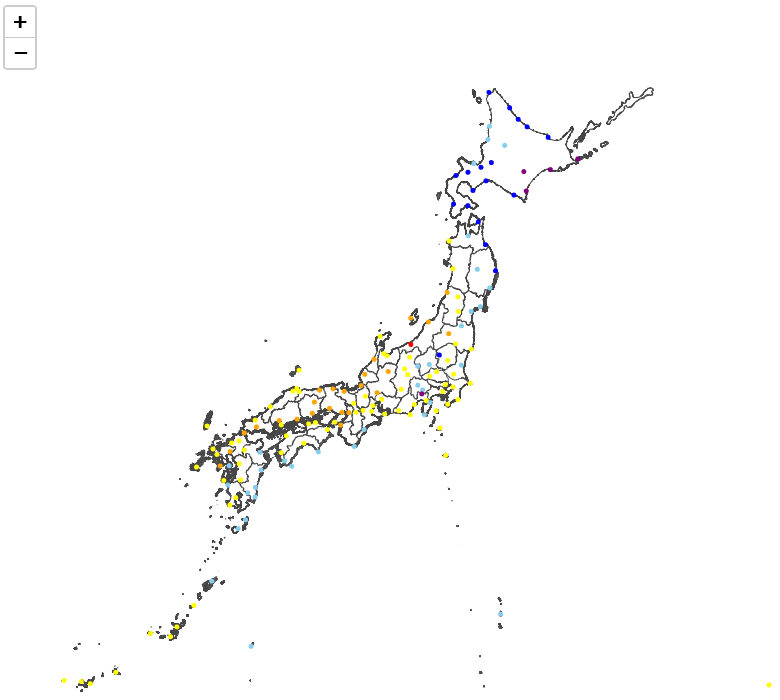
プロットいっぱい -最高気温- →
もっと処理が煩雑になってくるとJavaScriptでは厳しそう。オンライン処理も重くなってくる。
要は処理の結果が描画できればよいわけで、
- GISソフト + シェープファイル
- R言語 + シェープファイル
- R言語 + Leaflet
あたりが良さそう。